
13 ways our shopping habits statistics changed in 2023
You may also like:
You are about to see a list of our shopping habits statistics that you should know.
On this page you’ll find hand-picked consumer behavior statistics related to:
Increased Spending on Restaurants
1. Americans spent more money at restaurants than on groceries in 2022, with an increase of over 20%. (Yahoo News).
| Rising grocery prices | Grocery store prices have increased by more than 8% compared to the previous year |
| Preference for eating out | Convenience and increased socialization after the pandemic are major factors behind this preference |
| Inflation impact | Due to the high cost of groceries, more people opt for restaurant meals and food delivery services |
| Convenience over home cooking | Consumers find eating out or ordering food delivery more convenient than cooking at home, especially for individuals living alone or with busy schedules |
Reviews Drive Consumers’ Decisions
2. Approximately 70% of online shoppers read product reviews before making a purchase.” (Statica)
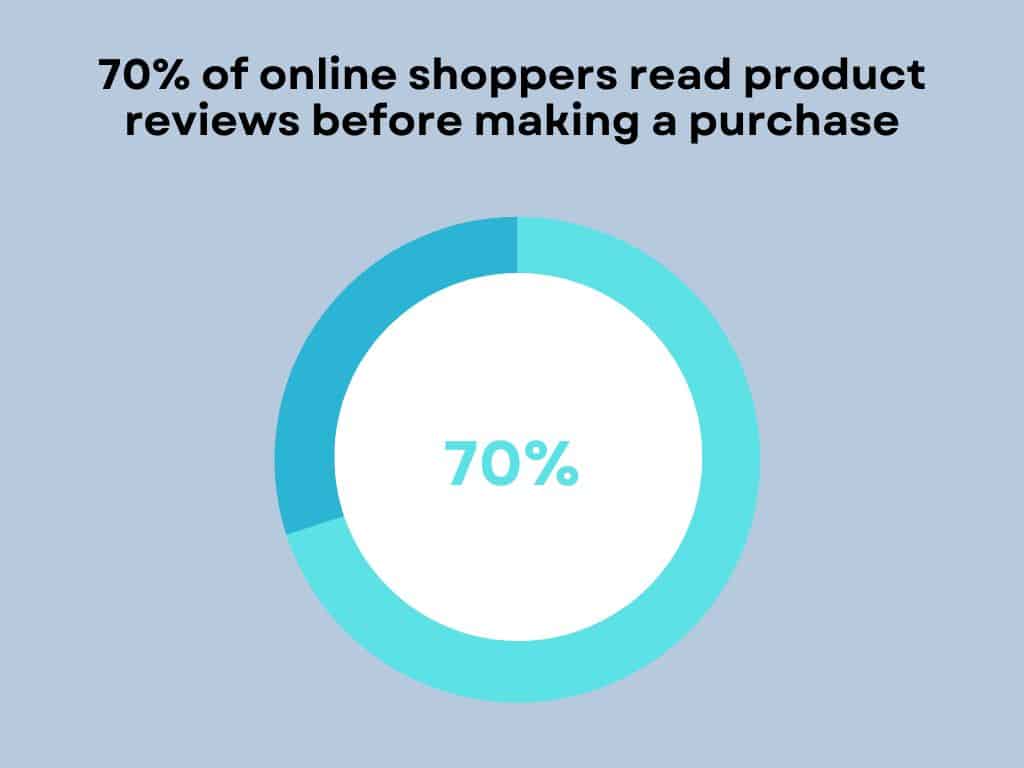
What we observed from the survey
- Most shoppers use search engines and social media platforms to make purchase decisions.
- Consumers prefer businesses with a higher volume of reviews
- Consumers may be skeptical of perfect ratings and find an average rating of 4.5 to five stars more appealing.
- High-priced products require more thorough research from consumers, making reviews even more critical.
- Customers trust businesses more when they see a mix of good and bad reviews.
E-commerce Returns Insights
3. In 2022, returns cost retailers approximately US$816 billion in lost sales. This amount is nearly as much as the U.S. spent on public schools. (Nevada Current)
Environmental impact of returns on our shopping habits
4. Returns contribute significantly to carbon dioxide emissions due to transportation and packaging waste. (Nature)
5. In 2022, returns generated around 24 million metric tons of carbon dioxide emissions, contributing to sustainability problems for retailers and the planet. (Optoro)
6. Plastic, paper, or cardboard from the return packages often become waste
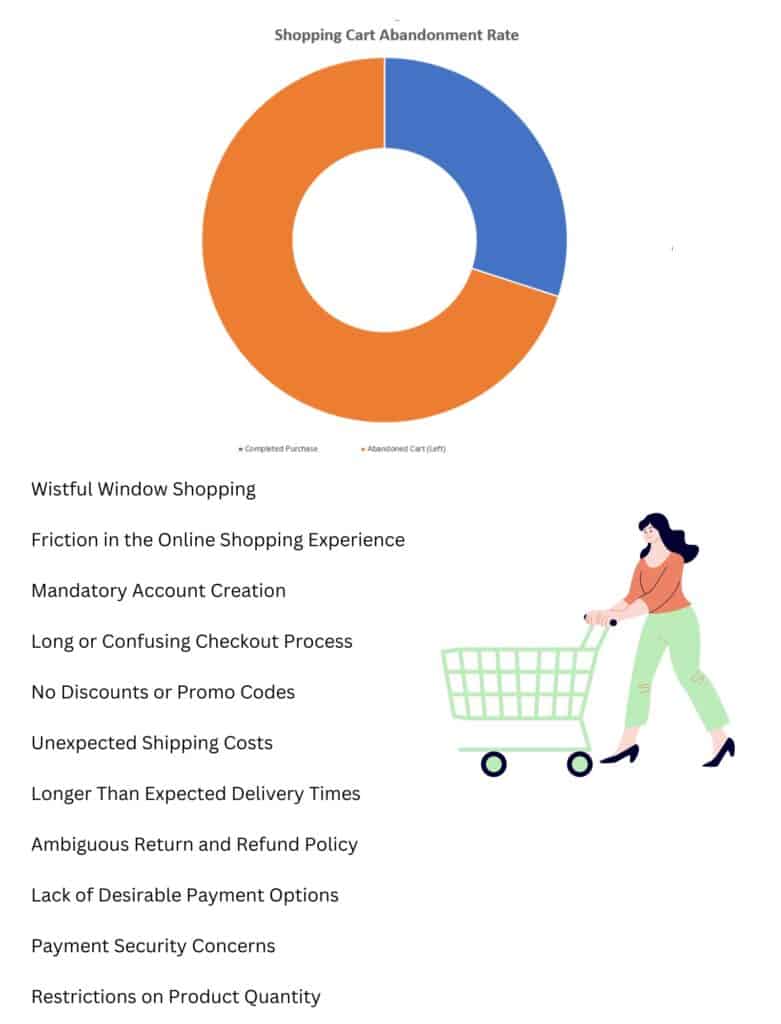
Shopping Cart Abandonment Rate
7. For every 10 customers who add an item to their shopping cart, seven of them leave without completing the purchase. (Big Commerce)
Checkout Aisle impulse
8. Impulse buys at the checkout counter account for about 40 to 80% of unplanned purchases. (Journal of retailing and consumer services)
Online Shopping Preferences
Online shopping statistics
9. In 2023, 91% of online purchases are made using smartphones. (Pew Research Center)
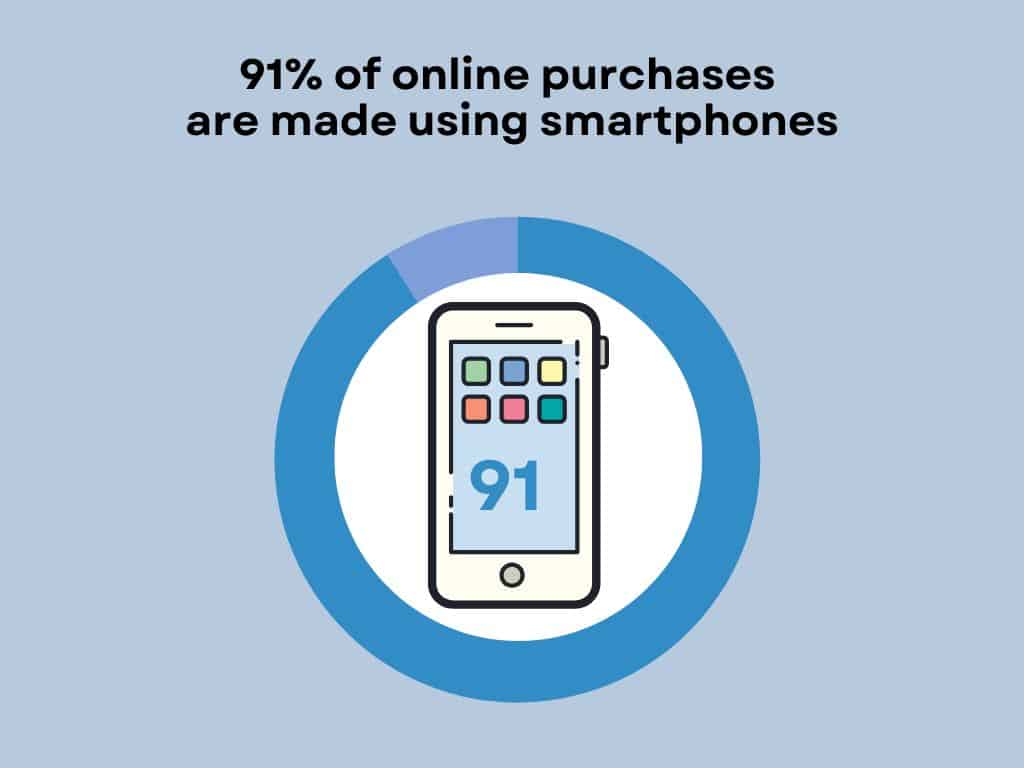
What learned from the survey:
- Men are more likely than women to make online purchases on a computer (72% vs. 66%).
- 57% of U.S. adults prefer in-person shopping, while 38% prefer online shopping.
- Adults under 50 are more likely to prefer buying online than those aged 50 and older.
Influence of Social Media on Purchases
10. 40% make a purchase because of social media influence. (Forbes)
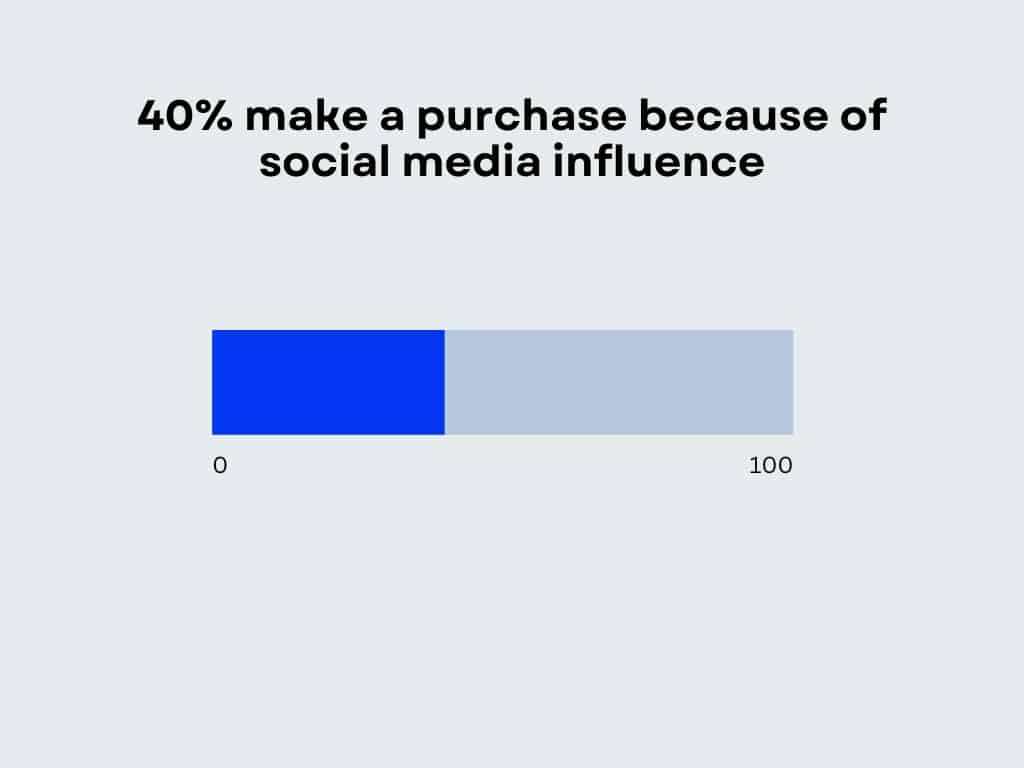
Key takeaways from the survey:
- Among social media users who follow influencers, 53% have purchased something based on influencer posts.
- Younger adults and women are more likely to make purchases influenced by influencers.
- Social media users with lower incomes are as likely as those with higher incomes to make purchases based on influencer posts.
Free Shipping Influence on Purchasing Behavior
11. Over 60% of shoppers are more likely to make a purchase if a website has a free shipping offer. (Chain Store Age)
What we learned from the survey:
- 75% of consumer respondents prefer free shipping over fast shipping.
- The most important information consumers want to see on a retailer’s website is the shipping cost, followed by the average shipping time when the item will ship, and the expected delivery date.
- 45% of consumer respondents consider free return shipping as the most important aspect when making online returns.
- Other factors that matter include ease of processing a return (24%), quick refunds (18%), longer returns timeframe (9%), and some respondents (4%) care about other aspects.
Deal-Seeking Behavior
12. Consumers are switching to digital shopping to find better prices and deals compared to in-store shopping. (PYMNTS)
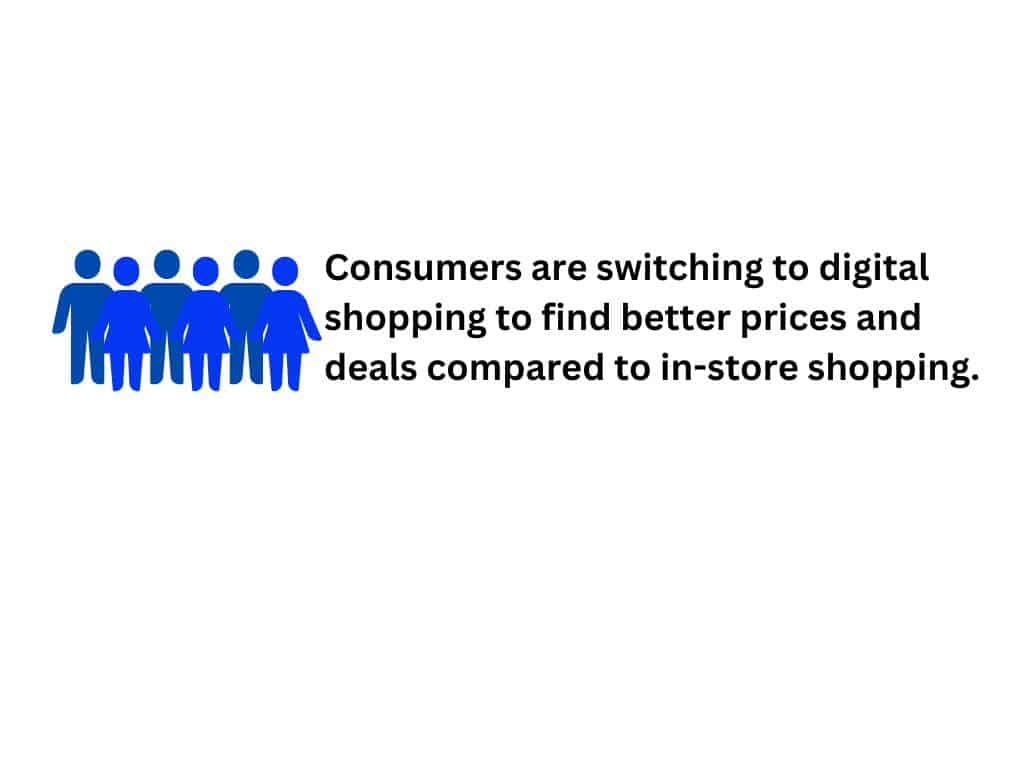
Takeaways from the survey:
- Customers who are price-sensitive and have lower engagement with eCommerce are more inclined to shop in physical stores.
- Consumers who are motivated by finding the best deals, sales, and coupons are more likely to choose brick-and-mortar stores for grocery shopping.
- 59% of middle-income consumers prioritize good deals when choosing where to shop.
- Nearly half of grocery and retail shoppers are willing to switch from their favorite brand to a less expensive competitor. (PYMNTS)
Money-saving Strategies in 2023
13. 80 percent of European consumers are taking actions to alleviate the pressure on household income caused by continuing price increases. (McKinsey & Company)
What we learned from the survey:
- One in three consumers tracks their expenses more carefully, while just under a third are reducing their savings rate and using their savings to cover expenses.
- Both low-income and higher-income consumers are adjusting their spending habits to cope with rising prices.
- Nonessential categories like fashion, home decor, and dining out are experiencing the most significant reduction in spending while spending on groceries, baby supplies, personal care, and pet supplies remains relatively stable.
- Purchasing fewer or smaller items is a popular strategy, particularly for fresh produce, meat, and dairy products.
- Consumers are also shopping around for better deals, buying in bulk, and considering lower-priced retailers and brands to save money.
Now I’d like to hear from you.
Do you have other interesting statistics to share?
Leave a comment down below right now.